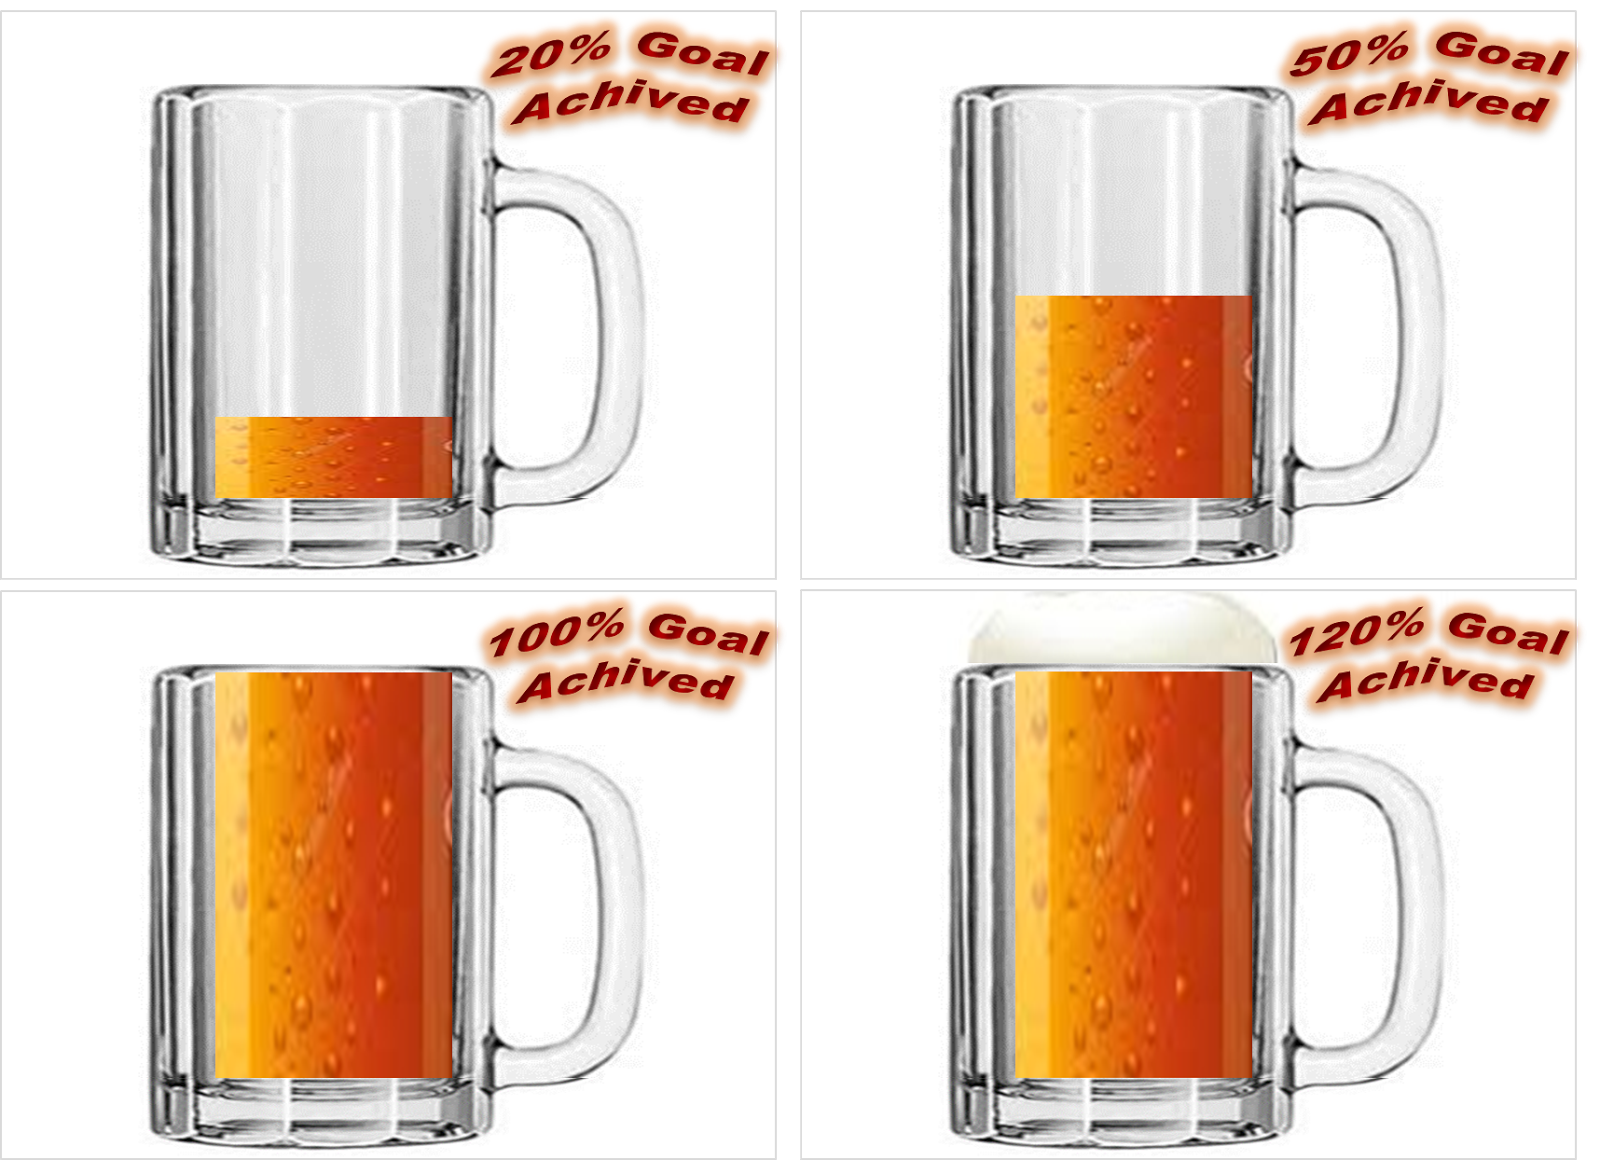
Beer mug chart can be used to showcase KPI metrics between 0 to 120% (20% bonus). Below are the images of beer mug charts for 20%, 50%, 100% and 120%.
As showing in below images, beer position will be changed whenever metric value will be changed. whenever metric value will be more then 100% (up to 120%) a beer foam will be displayed on beer mug.


No comments:
Post a Comment